RJ Market Watch
Uday Jewellery Standalone December 2020 Net Sales at Rs 38.19 crore, up 48.14% Y-o-Y


Reported Standalone quarterly numbers for Uday Jewellery Industries are:
Net Sales at Rs 38.19 crore in December 2020 up 48.14% from Rs. 25.78 crore in December 2019.
Quarterly Net Profit at Rs. 2.56 crore in December 2020 up 72.12% from Rs. 1.49 crore in December 2019.
EBITDA stands at Rs. 3.52 crore in December 2020 up 52.38% from Rs. 2.31 crore in December 2019.
Uday Jewellery EPS has increased to Rs. 1.16 in December 2020 from Rs. 0.68 in December 2019.

Uday Jewellery shares closed at 139.65 on February 02, 2021 (BSE)
UDAY JEWELLERY INDUSTRIES
STANDALONE QUARTERLY RESULTS IN RS. CR.
DEC’20 SEP’20 DEC’19
Net Sales/Income from operations 38.19 13.66 25.78
Other Operating Income — — —
Total Income From Operations 38.19 13.66 25.78
EXPENDITURE
Consumption of Raw Materials 34.21 16.74 30.21
Purchase of Traded Goods — — —
Increase/Decrease in Stocks 0.47 -5.52 -7.01
Power & Fuel — — —
Employees Cost 0.28 0.16 0.25
Depreciation 0.05 0.05 0.05
Excise Duty — — —
Admin. And Selling Expenses — — —
R & D Expenses — — —
Provisions And Contingencies — — —
Exp. Capitalised — — —
Other Expenses 0.16 0.09 0.13
P/L Before Other Inc. , Int., Excpt. Items & Tax 3.01 2.14 2.15
Other Income 0.46 0.15 0.12
P/L Before Int., Excpt. Items & Tax 3.47 2.29 2.26
Interest 0.15 0.14 0.20
P/L Before Exceptional Items & Tax 3.32 2.15 2.06
Exceptional Items — — —
P/L Before Tax 3.32 2.15 2.06
Tax 0.76 0.49 0.57
P/L After Tax from Ordinary Activities 2.56 1.66 1.49
Prior Year Adjustments — — —
Extra Ordinary Items — — —
Net Profit/(Loss) For the Period 2.56 1.66 1.49
Equity Share Capital 22.02 22.02 22.02
Reserves Excluding Revaluation Reserves — — —
Equity Dividend Rate (%) — — —
EPS Before Extra Ordinary
Basic EPS 1.16 0.75 0.68
Diluted EPS 1.16 0.75 0.68
EPS After Extra Ordinary
Basic EPS 1.16 0.75 0.68
Diluted EPS 1.16 0.75 0.68
Public Share Holding
No Of Shares (Crores) — — —
Share Holding (%) — — —
Promoters and Promoter Group Shareholding
- a) Pledged/Encumbered
– Number of shares (Crores) — — —
– Per. of shares (as a % of the total sh. of prom. and promoter group) — — —
– Per. of shares (as a % of the total Share Cap. of the company) — — —
- b) Non-encumbered
– Number of shares (Crores) — — —
– Per. of shares (as a % of the total sh. of prom. and promoter group) — — —
– Per. of shares (as a % of the total Share Cap. of the company) — — —
Source : Dion Global Solutions Limited
Courtesy: Money Control


With ‘Uncut Conversations’, Zaveri Bros Diamonds & Gold seeks to build deep, meaningful customer relationships

Thangals Jewellery celebrates International Women’s Day by recognizing employees at its all-women showroom in Dubai

Kirthi Diamonds’ new capsule collection is influenced by iconic characters and elements from Harry Potter films

Abharan Jewellers’ contest asks brides-to-be to document their in-store wedding jewellery shopping journey

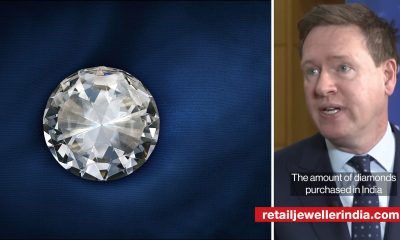
India has overtaken China to become second largest diamond market: De Beers CEO Al Cook

US-based private equity firm Advent International to acquire Orra Fine Jewellery, say media reports

The House of Rose debuts in Mumbai with a 21,000 sq. ft. experiential concept space showcasing fine jewellery and luxury watch brands

Eminent jeweller Viren Bhagat sets up first global boutique in London’s Mayfair

 Wide Angle4 weeks ago
India has overtaken China to become second largest diamond market: De Beers CEO Al Cook
- Daily News1 month ago
US-based private equity firm Advent International to acquire Orra Fine Jewellery, say media reports
- Exclusive2 months ago
The House of Rose debuts in Mumbai with a 21,000 sq. ft. experiential concept space showcasing fine jewellery and luxury watch brands
- Wide Angle1 month ago
Eminent jeweller Viren Bhagat sets up first global boutique in London’s Mayfair